Category: Spotlight

FF-ImmigrantPops-Header3

Flourishing Facts – Immigrant Populations

Why is it important to understand migration patterns and growing immigrant populations?

Imagine moving to a new country, excited to build a life and ready to offer your skills, education, and talents to your new community – but running into barriers and struggling to make your dreams a reality. In our mostly American born and raised, English-speaking region, it’s rare to encounter language or cultural barriers. But many do. 1% of the area overall and as much as 17% of households in pockets of our rural and urban areas are not proficient in English.

Language is an obvious barrier but beyond unfamiliar words – complicated systems, even discrimination can feel like invisible walls to new arrivals, hindering the ability to integrate and contribute their gifts. And chances are, moving to an unfamiliar country means leaving social networks behind. Who do you call for advice? For help? All these barriers can stand in the way of getting basic needs met, like getting food or medical care, and can hinder efforts to fully engage in opportunities, like education and employment, or offer resources, like skilled trades, professional services, and talents to our region.

The U.S. has a rich history of immigration with people seeking economic opportunity or escaping hardship. 14% of the region’s residents who relocate do so mainly across town or county but a small and important .3% relocate here from abroad.

Our population center, Vanderburgh County, boasts a vibrant tapestry of cultures. Hispanic Latino populations make up the largest foreign-born group (30%), and smaller but growing communities like Marshallese (.2%), Haitian (.2%), and Chinese (.6%) add to our richness. Though small, the percentage of foreign-born residents is increasing over time.

Data on where our residents are born begins to help us understand how migration patterns are shifting.

There are limitations to traditional survey methods. For many reasons, surveys like the Census may undercount immigrant populations and localized studies are needed. Funding partners, nonprofits, economic development agencies, alongside champions of immigrant populations are working to better understand the demographic shifts and to provide welcome resources and services to support incoming residents. The goal? To celebrate and support the rich variety of peoples and cultures that make our region thrive.

Find more data on immigrant populations

Here are quick links to Grow/SAVI resources to help you learn more about immigration populations.

  • Hispanic and Latinos Profile – learn more about the fastest growing ethnicity.
  • Community Profile Tool – data for specific geographies, like counties, zip codes, and neighborhoods. (Pro tip: not all data is available for small geographies, like neighborhoods. If you run into missing data, try a slightly larger area, like the zip code that encompasses the neighborhood.)
  • Grow Library – for additional learning resources on healthy food access, poverty, flourishing, and more.

Let’s celebrate our diverse region! Share your data insights on this topic with colleagues, community partners, and on social media.
Flourishing Facts Healthy Food Access

Flourishing Facts – Healthy Food Access

Why is healthy food access important?

As winter makes its exit, gardeners have started nurturing tiny tomato and pepper seedlings, dreaming of summertime harvests. But not everyone has the luxury of a garden or even easy access to fresh produce. Food insecurity is one of our region’s challenges – having food to eat is a critical need. But healthy food access goes one step beyond filling plates – it’s about ensuring quality, nutrient-packed, fresh food is within reach for everyone. In our region, many miss out on the health benefits of a vibrant diet rich in fruits and vegetables. According to the 2021 Greater Evansville Health Survey, nearly 1 in 4 residents, 23% of the region, wants to but is unable to purchase fresh fruits and vegetables. With 6% of households without vehicles, 24% burdened by their housing costs alone, 12% living below the poverty line, and another 37% of ALICE households (Asset Limited Income Constrained Employed) grappling to make ends meet, healthy food for all can feel like a distant dream.

The cost of nutritious foods and how far you live from stores where healthy foods are likely to be offered can be significant barriers. “Low food access” and “food desert” data helps communities begin to understand these barriers.

There are pockets of inner-city Evansville and rural areas where up to 100% of the population lives in a food desert. Welborn Baptist Foundation, along with nonprofits, collaborations, and community partners, are working to better understand the barriers and opportunities. Innovative solutions for reducing transportation barriers, empowering local growers, and implementing bulk-buying programs, pop-up markets, and other strategies can help our region cultivate a future where healthy food isn’t a privilege but a right for all.

Find more data on food access and related issues

Here are quick links to Grow/SAVI resources to help you learn more about how issues around food impact the people you serve and care about. 

  • Basic Needs Topic Profile – healthy food access, transportation access, and other regional insights.
  • Community Profile Tool – data for specific geographies, like counties, zip codes, and neighborhoods. (Pro tip: not all data is available for small geographies, like neighborhoods. If you run into missing data, try a slightly larger area, like the zip code that encompasses the neighborhood.) 

Grow Library – for additional learning resources on healthy food access, poverty, flourishing, and more. 

Let’s sow seeds of change together! Share your data insights with colleagues, community partners, and on social media.

Screenshot 2024-02-06 at 1.41.57 PM

Join us in celebrating the advancement of two of our leaders into new roles.

WBF continues to focus on impact and capacity building, reinforced by the promotion of two of our team members into two brand-new roles.


Candice Perry has been promoted to Chief Capacity Building Officer (CCBO).  In addition to Candice’s continued oversight of our Nonprofit Excellence Impact Area, as CCBO, Candice will lead our internal capacity building efforts by working with our team to create tailored professional development plans, skill enhancement programming, leadership development, and grow our team collaboration and effectiveness.


Andrea Hays has been selected as the Foundation’s Chief Program and Impact Officer (CPIO).  As CPIO, Andrea will lead our Programs and Impact Team (impact areas, learning, and Upgrade) by working to better integrate our strategies across impact areas and programs with a holistic view of our grantmaking portfolio and partnerships.

About Candice Perry


Candice joined the Foundation in 2016 as the Nonprofit Excellence Program Officer, tasked with building capacity among nonprofits in the areas of Next Generation Leadership and Organizational Effectiveness.


With a Social Service and Psychology emphasis, Candice attended the University of Maryland, Asian Division at the Yokota Air Force Base, Japan, and graduated from the University of Southern Indiana. She holds certificates from the Fundraising School and Executive Education from IU SPEA and is a past ATHENA Leadership Award nominee.


Candice began her nonprofit career in 1993 with Albion Fellows Bacon Center, a domestic and sexual violence shelter/advocacy center in Evansville, IN.  Over 23 years at Albion, Candice spent 15 years supplying direct services to victims as a Legal Advocacy Program Coordinator and later became Executive Director in 2008.


She has served in lead roles for community initiatives, including the Vanderburgh County Women’s Fund, the COVID-19 Response Fund of the Greater Evansville Region, Grow, and the William H. Koch Charitable Trust.


Candice and her husband Bryan live in Evansville, as do their two children and grandchild.

About Andrea Hays


Andrea joined WBF in 2008 and most recently served as the Foundation’s Healthy Communities Program Officer, overseeing the Foundation’s health initiatives.

She earned her master’s degree in public health from Indiana University and completed the MidAmerica Regional Public Health Leadership Institute fellowship program.

Andrea was selected as one of the 2020 Junior League of Evansville’s 20 Women in Business. In 2013, she was recognized as a White House Champion of Change for her leadership with the CDC Community Transformation Grant awarded to Southwest Indiana. She is a proud member of the Healthy Communities Partnership and is on the Board of Directors for both the Evansville Trails Coalition and Evansville Youth Soccer League. Andrea also serves as an adjunct faculty with the University of Southern Indiana’s College of Nursing and Health Professions.

Andrea lives in Evansville with her husband, Andrew, and their three children.

FF_FamInPoverty FeatureImage

Flourishing Facts – Families in Poverty

Why is poverty data important?

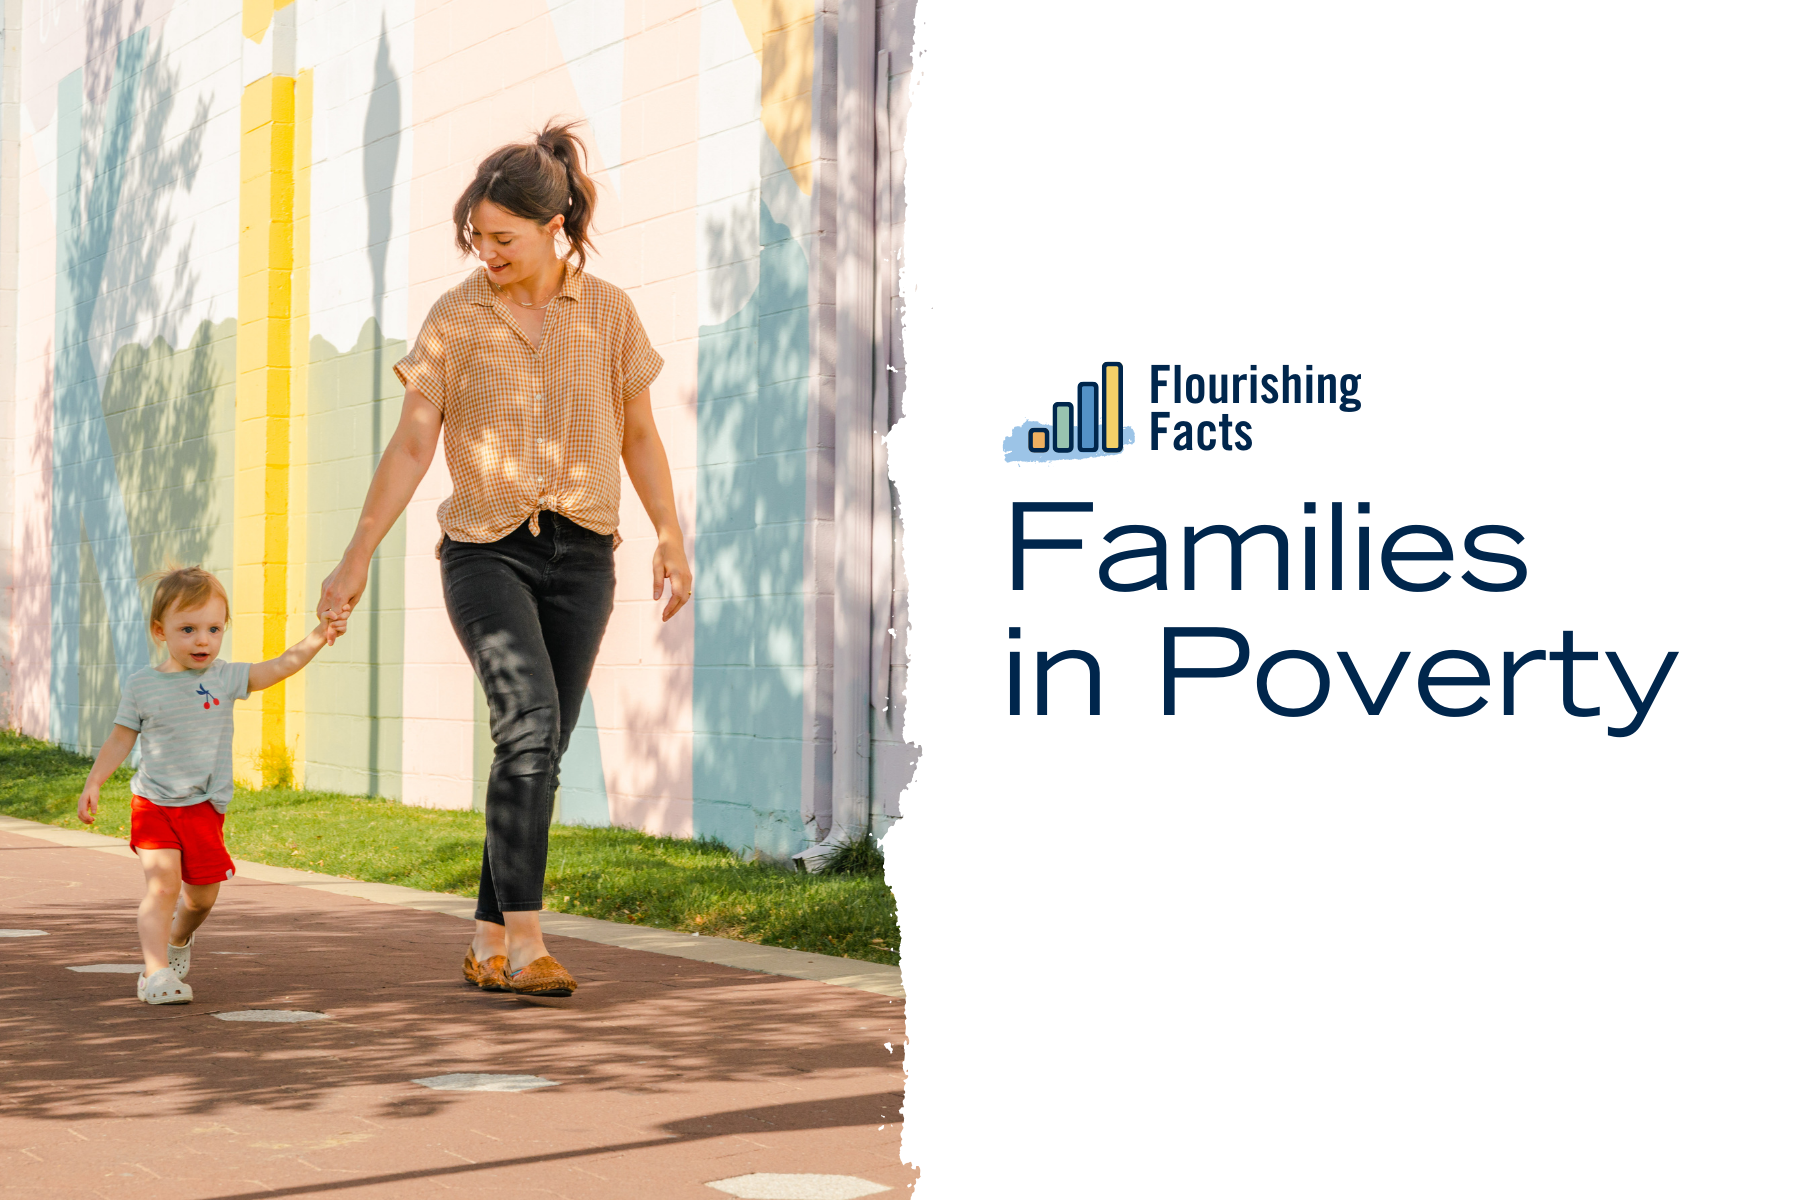
Imagine being a single mother trying to put food on the table for your kids. Every penny counts, but even working two jobs, you barely scrape by. This is the reality for too many in the greater Evansville region, where 15% of families with children grapple with poverty. And when you also consider the additional 37% of “ALICE” families who are technically over the poverty threshold but are not making ends meet, that’s a lot of households struggling financially. This burden impacts everything, from access to healthy food to affording a safe home. But it’s not a uniform struggle. While poverty overall has decreased over the last five years of data, some rural areas like Boonville and Fort Branch saw a worrying rise. And the fight is far from over for communities of color, burdened with disproportionately high rates.

There is some good news for neighborhoods.

*Greater Evansville Region includes Vanderburgh, Warrick, Gibson, Posey, IN and Henderson, KY.  “Poverty Rates for Families with Children” data comes from the most recent American Community Survey data release, 2022, soon to be updated in Grow/SAVI.

WBF has a high level of investment and partnership with poverty-alleviation efforts through Place-based initiative investing. Grantee partners like Community One, Potter’s Wheel, Dream Center, Hope City Church, Audubon Kids Zone, and others work alongside community partners and funders like us to increase flourishing through a relational, asset-based approach.

Find more data on poverty and related issues

Poverty solutions are complex and data helps empowers action. Here are some ways to learn more about poverty in areas you serve and care about.

(Pro tip: not all data is available for small geographies, like neighborhoods. If you run into missing data, try a slightly larger area, like the zip code that encompasses the neighborhood.)

Share something you learn or that inspires you with your co-workers, collaborations, or community partners!

Grow_Cover

What is Grow?

Grow is a capacity building platform!

Organizations from all sectors must collaborate to grow their capacity for impact. Grow provides a proactive way to collaboratively build capacity for impact within our community by bringing together nonprofit and donor/funder communities, businesses, and other community stakeholders and providing systems-level supports.

Welborn is honored to be a part of bringing Grow to the Greater Evansville Region.

Visit growcapacity.info to continue your own capacity building journey.

rptc_2021

How Quality of Place Impacts Economic Development – A WBF Case Paper

To build a robust and resilient economy, communities need to invest in Quality of Place.
Current and future talent are prioritizing Quality of Place over employment opportunities. Communities that invest in Quality of Place see long-term benefits economically and at the individual and community level.

Quality of Place is essential in attracting and retaining talent for community economic growth, especially due to the unique remote work trends seen during COVID-19. The Project for Public Spaces determined four main areas that make up a great place: sociability, uses and activities, access and linkages, and comfort and image.

Learn more by reading our Case Paper – How Quality of Place Impacts Economic Development

SocialDeterminants

Social Determinants of Health, COVID-19, and minorities – how they’re connected

Over the past several months, we’ve highlighted the topic of the Social Determinants of Health.  For the sake of review, these are the environmental and social factors that affect our overall health.  Where we live.  Access to quality food, healthcare, and education.  Our relationships.  And research has shown that these factors have a greater effect on our health than our genetics.

The recent events in our country (and world) have shed light on these realities in a very real and visible way.  And while the topics of the effects of COVID-19 and racial inequity and inequality may seem mutually exclusive, there’s evidence to support the fact that they are very much related.

The Center for Disease Control has provided a great resource that looks specifically at the issue with its report on COVID-19 in Racial and Ethnic Minority Groups.  This resource speaks directly to how the Social Determinants of Health have played a significant role in the effects of COVID-19 on minority groups on a national level.  Additionally, the Vanderburgh County Health Department has provided ongoing updates on COVID-19 with racial and ethnic breakdowns as well as geographic breakdown (by zip code).
If we look at these two resources together, coupled with what we know of the Social Determinants of Health and Health Equity, we start to see a compelling picture.

For instance:

The Vanderburgh County Health Department reports that, of the total population of Vanderburgh County, 85.8% are white and 9.7% are black.  Of the 362 confirmed cases of COVID-19 in Vanderburgh County (as of June 24), 64.6% are white residents and 23.8% are black.  Why is it so disproportionate?

The CDC sheds some light on that. “Health differences between racial and ethnic groups are often due to economic and social conditions that are more common among some racial and ethnic minorities than whites. In public health emergencies, these conditions can also isolate people from the resources they need to prepare for and respond to outbreaks.”

Living Conditions – “Members of racial and ethnic minorities may be more likely to live in densely populated areas because of institutional racism in the form of residential housing segregation. People living in densely populated areas may find it more difficult to practice prevention measures such as social distancing.” (CDC)

Work Circumstances – “Nearly a quarter of employed Hispanic and black or African American workers are employed in service industry jobs compared to 16% of non-Hispanic whites.”(CDC)

Underlying health conditions and lower access to care – “Compared to whites, Hispanics are almost three times as likely to be uninsured, and African Americans are almost twice as likely to be uninsured. In all age groups, blacks are more likely than whites to report not being able to see a doctor in the past year because of cost.” (CDC)

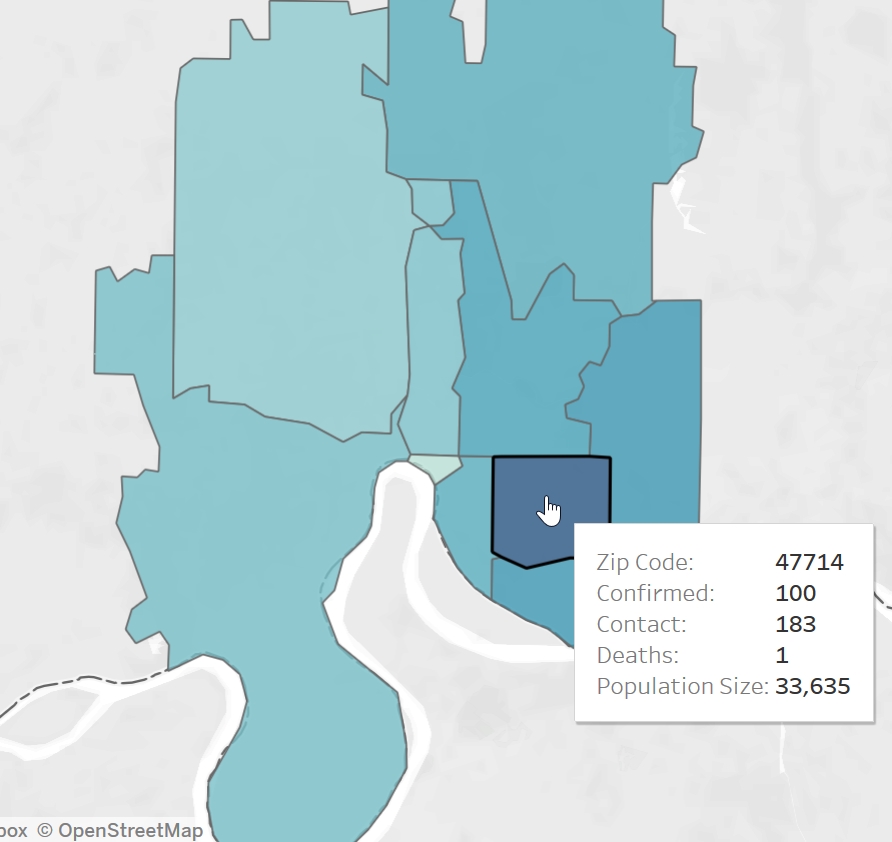
If we isolate the 47714 zip code of Vanderburgh County, we can see that it accounts for less land area than most of the other counties; however, it has the highest concentration of residents of all of the zip codes at 33,635.  Of these residents, 73.5% are white and 13.4% are black.  47714 also has the highest number of confirmed cases with 100.  The next most populous zip code, 47713 has 30,759 residents with 49 confirmed cases.  The 47714 zip code is densely populated and has a larger minority population as compared to the county overall and, according to the CDC, these minority residents are more likely to have living, work, and healthcare circumstances that make them more susceptible. 

This is just some of what we can take away from the resources that are provided to us.


This matters because…

Effective action requires understanding.  By understanding how threats, such as COVID-19, affect people differently, we can begin to shape unique, equitable approaches to addressing the needs.

Please take some time to take a look for yourself.


Resources
Vanderburgh County Health Department COVID-19 Data Dashboard
CDC: COVID-19 in racial and ethnic minority groups

site_logo

Data Equity

by Liz Tharp, Impact & Learning Officer

Data is everywhere. Communities and organizations use data to highlight needs, to design programs and services, to learn and measure change. If equity is not considered, data can help promote the very injustices, biases and inequitable conditions that communities work hard to improve. 

Understanding what ‘data’ is and the risks associated helps us better steward data resources to promote equity in communities.

Data takes many forms beyond numbers. The Equitable Evaluation Initiative (EEI) is a national movement that influences funders to balance their desire to use numbers with an understanding of context and the nuances of culture. EEI realizes that numbers alone do not tell the whole story. Beyond numeric data – pictures, videos and stories are types of data that are valuable and necessary to more clearly understand the people and conditions of our region.

Unless we’re intentionally thinking about ‘equity,’ data can reinforce the very conditions communities work to improve.  Data from our last Health Survey highlights this point. We learned that 1 in 4 (24%) adults in Vanderburgh County have problems accessing fresh produce. Good data but focusing on this point alone would cause us to overlook an area of inequity. A closer look shows that half (48%) of all residents living in the 47713-zip code, have problems accessing fresh produce. Conversations with organizations and collaborations serving residents in this zip code back up the story this data is telling. If communities are not considering issues of equity with their data, they can risk designing solutions that leave out important geographies and populations.

24% of Vanderburgh County48% of 47713 zip code
Low access to fresh fruits and vegetables 2015 Tri-State Health Survey, WBF

Being good stewards of data means intentionally thinking about equity in all aspects of data usage.  WBF incorporates equity thinking into each of the four large-scale, multi-county surveys we commission. Breaking down data by variables like race, ethnicity, zip code, income level, etc. is called ‘data disaggregation’ and this step helps us look for stories of inequity buried in the data. WBF has also built a relationship-based evaluation system that requires periodic in-person interactions with grantees. The EEI says that the best approaches to evaluation with grantees, “would be jointly designed by the foundation and the people it supports, and it would take into consideration the feelings, stories, and concerns of those people, not just an outcome that can be measured numerically.” Data collection plans for grantees in each grant cycle are made jointly, reports are given face-to-face and a variety of data forms are accepted as reports.

This matters because…

Just as we aim to steward dollars, time, knowledge and expertise for maximum impact, we need to use data responsibly and to ensure that the data we use tells an accurate story about ALL the populations and conditions represented. More equitable data helps support more equitable strategies and decisions.