Category: Flourishing Facts

FF-ImmigrantPops-Header3

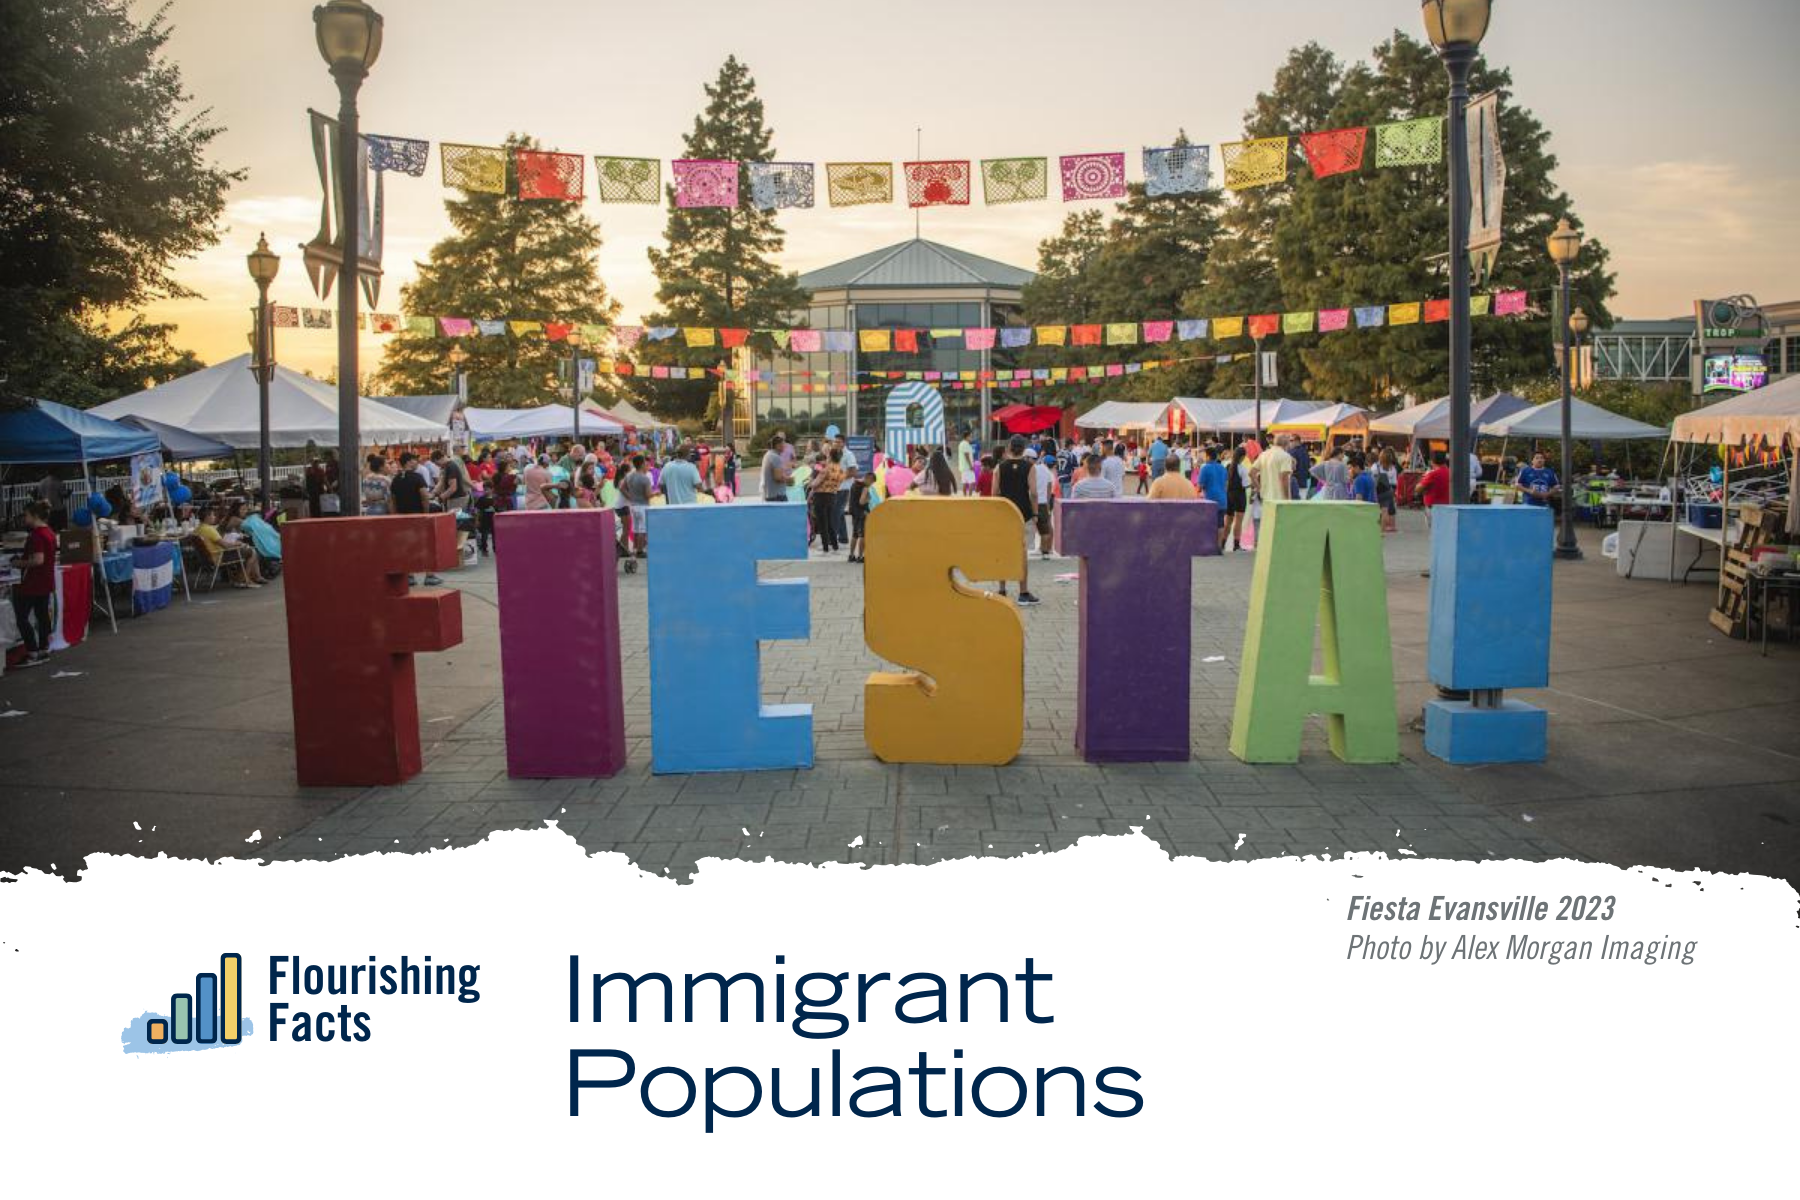
Flourishing Facts – Immigrant Populations

Why is it important to understand migration patterns and growing immigrant populations?

Imagine moving to a new country, excited to build a life and ready to offer your skills, education, and talents to your new community – but running into barriers and struggling to make your dreams a reality. In our mostly American born and raised, English-speaking region, it’s rare to encounter language or cultural barriers. But many do. 1% of the area overall and as much as 17% of households in pockets of our rural and urban areas are not proficient in English.

Language is an obvious barrier but beyond unfamiliar words – complicated systems, even discrimination can feel like invisible walls to new arrivals, hindering the ability to integrate and contribute their gifts. And chances are, moving to an unfamiliar country means leaving social networks behind. Who do you call for advice? For help? All these barriers can stand in the way of getting basic needs met, like getting food or medical care, and can hinder efforts to fully engage in opportunities, like education and employment, or offer resources, like skilled trades, professional services, and talents to our region.

The U.S. has a rich history of immigration with people seeking economic opportunity or escaping hardship. 14% of the region’s residents who relocate do so mainly across town or county but a small and important .3% relocate here from abroad.

Our population center, Vanderburgh County, boasts a vibrant tapestry of cultures. Hispanic Latino populations make up the largest foreign-born group (30%), and smaller but growing communities like Marshallese (.2%), Haitian (.2%), and Chinese (.6%) add to our richness. Though small, the percentage of foreign-born residents is increasing over time.

Data on where our residents are born begins to help us understand how migration patterns are shifting.

There are limitations to traditional survey methods. For many reasons, surveys like the Census may undercount immigrant populations and localized studies are needed. Funding partners, nonprofits, economic development agencies, alongside champions of immigrant populations are working to better understand the demographic shifts and to provide welcome resources and services to support incoming residents. The goal? To celebrate and support the rich variety of peoples and cultures that make our region thrive.

Find more data on immigrant populations

Here are quick links to Grow/SAVI resources to help you learn more about immigration populations.

  • Hispanic and Latinos Profile – learn more about the fastest growing ethnicity.
  • Community Profile Tool – data for specific geographies, like counties, zip codes, and neighborhoods. (Pro tip: not all data is available for small geographies, like neighborhoods. If you run into missing data, try a slightly larger area, like the zip code that encompasses the neighborhood.)
  • Grow Library – for additional learning resources on healthy food access, poverty, flourishing, and more.

Let’s celebrate our diverse region! Share your data insights on this topic with colleagues, community partners, and on social media.

Flourishing Facts Healthy Food Access

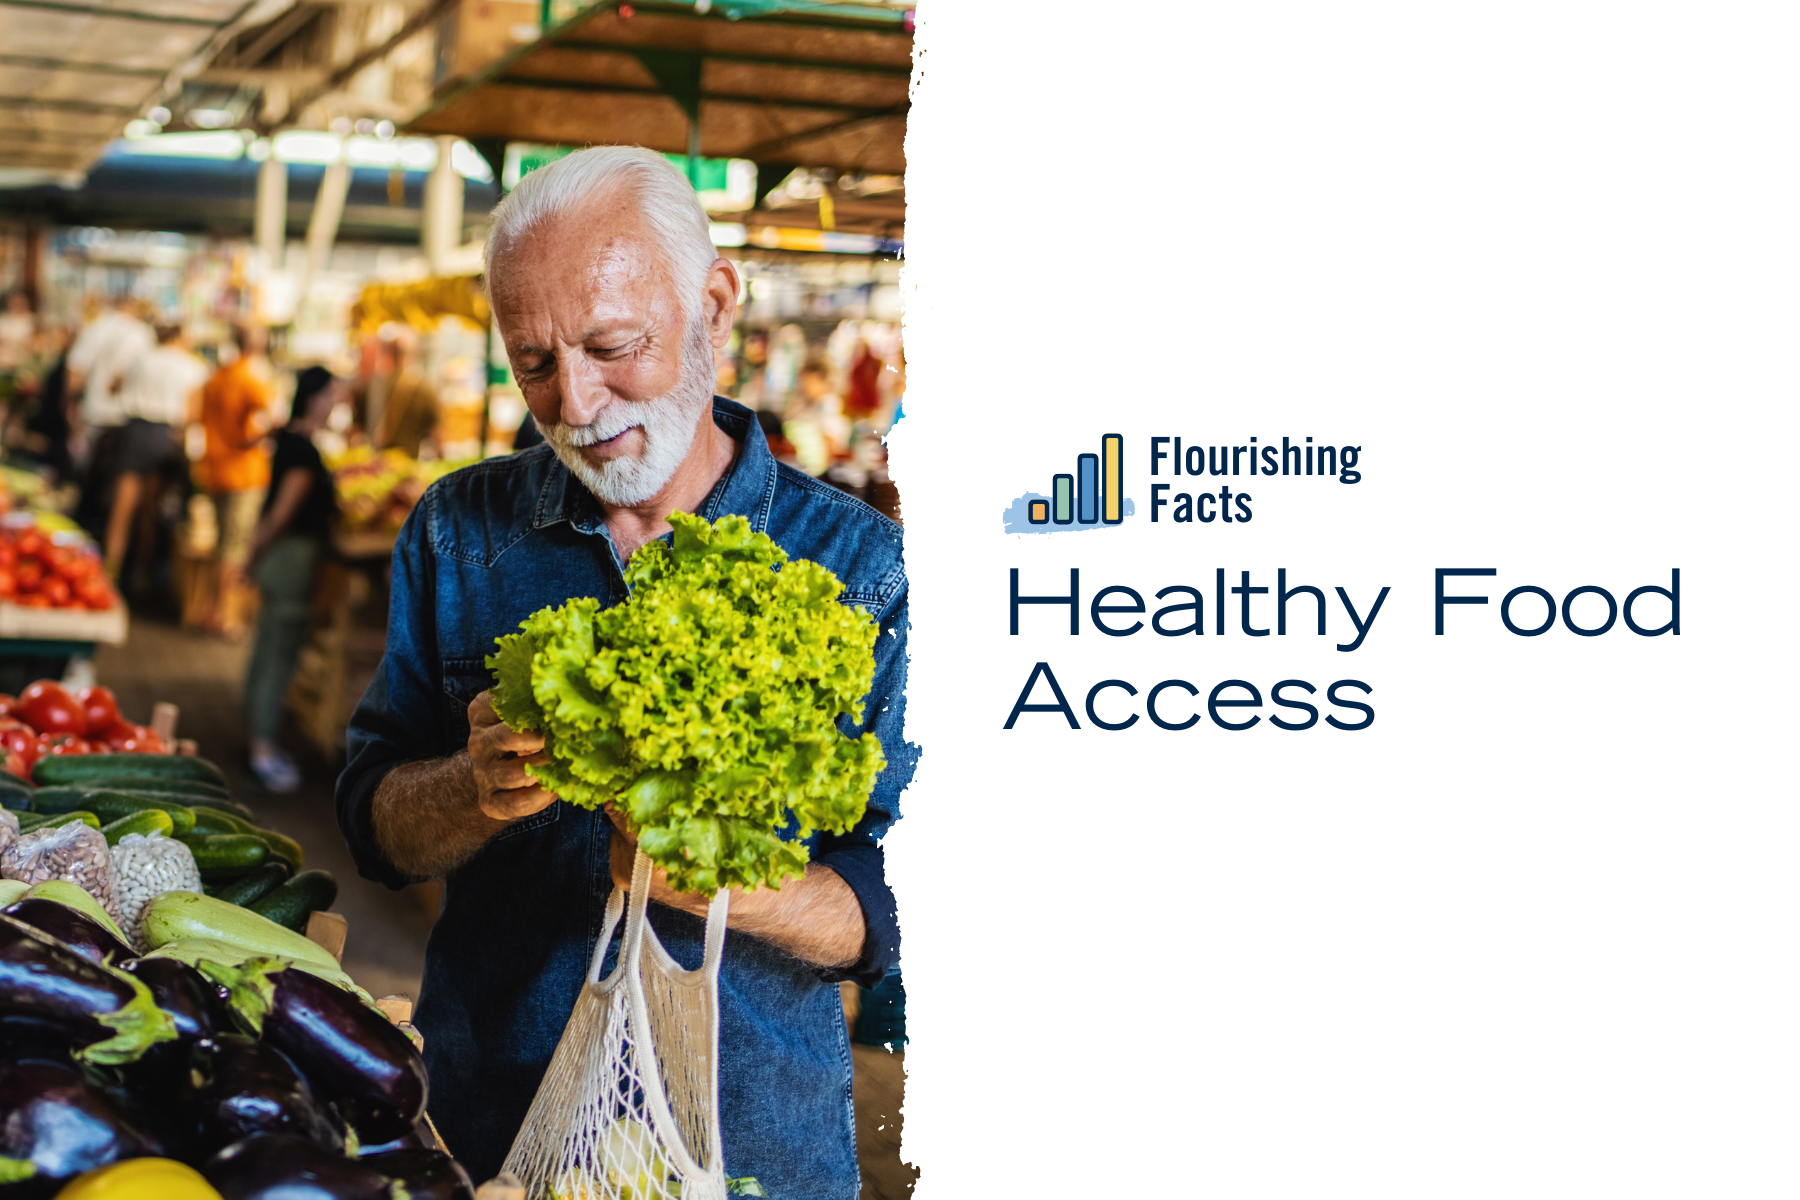
Flourishing Facts – Healthy Food Access

Why is healthy food access important?

As winter makes its exit, gardeners have started nurturing tiny tomato and pepper seedlings, dreaming of summertime harvests. But not everyone has the luxury of a garden or even easy access to fresh produce. Food insecurity is one of our region’s challenges – having food to eat is a critical need. But healthy food access goes one step beyond filling plates – it’s about ensuring quality, nutrient-packed, fresh food is within reach for everyone. In our region, many miss out on the health benefits of a vibrant diet rich in fruits and vegetables. According to the 2021 Greater Evansville Health Survey, nearly 1 in 4 residents, 23% of the region, wants to but is unable to purchase fresh fruits and vegetables. With 6% of households without vehicles, 24% burdened by their housing costs alone, 12% living below the poverty line, and another 37% of ALICE households (Asset Limited Income Constrained Employed) grappling to make ends meet, healthy food for all can feel like a distant dream.

The cost of nutritious foods and how far you live from stores where healthy foods are likely to be offered can be significant barriers. “Low food access” and “food desert” data helps communities begin to understand these barriers.

There are pockets of inner-city Evansville and rural areas where up to 100% of the population lives in a food desert. Welborn Baptist Foundation, along with nonprofits, collaborations, and community partners, are working to better understand the barriers and opportunities. Innovative solutions for reducing transportation barriers, empowering local growers, and implementing bulk-buying programs, pop-up markets, and other strategies can help our region cultivate a future where healthy food isn’t a privilege but a right for all.

Find more data on food access and related issues

Here are quick links to Grow/SAVI resources to help you learn more about how issues around food impact the people you serve and care about. 

  • Basic Needs Topic Profile – healthy food access, transportation access, and other regional insights.
  • Community Profile Tool – data for specific geographies, like counties, zip codes, and neighborhoods. (Pro tip: not all data is available for small geographies, like neighborhoods. If you run into missing data, try a slightly larger area, like the zip code that encompasses the neighborhood.) 

Grow Library – for additional learning resources on healthy food access, poverty, flourishing, and more. 

Let’s sow seeds of change together! Share your data insights with colleagues, community partners, and on social media.

FF_FamInPoverty FeatureImage

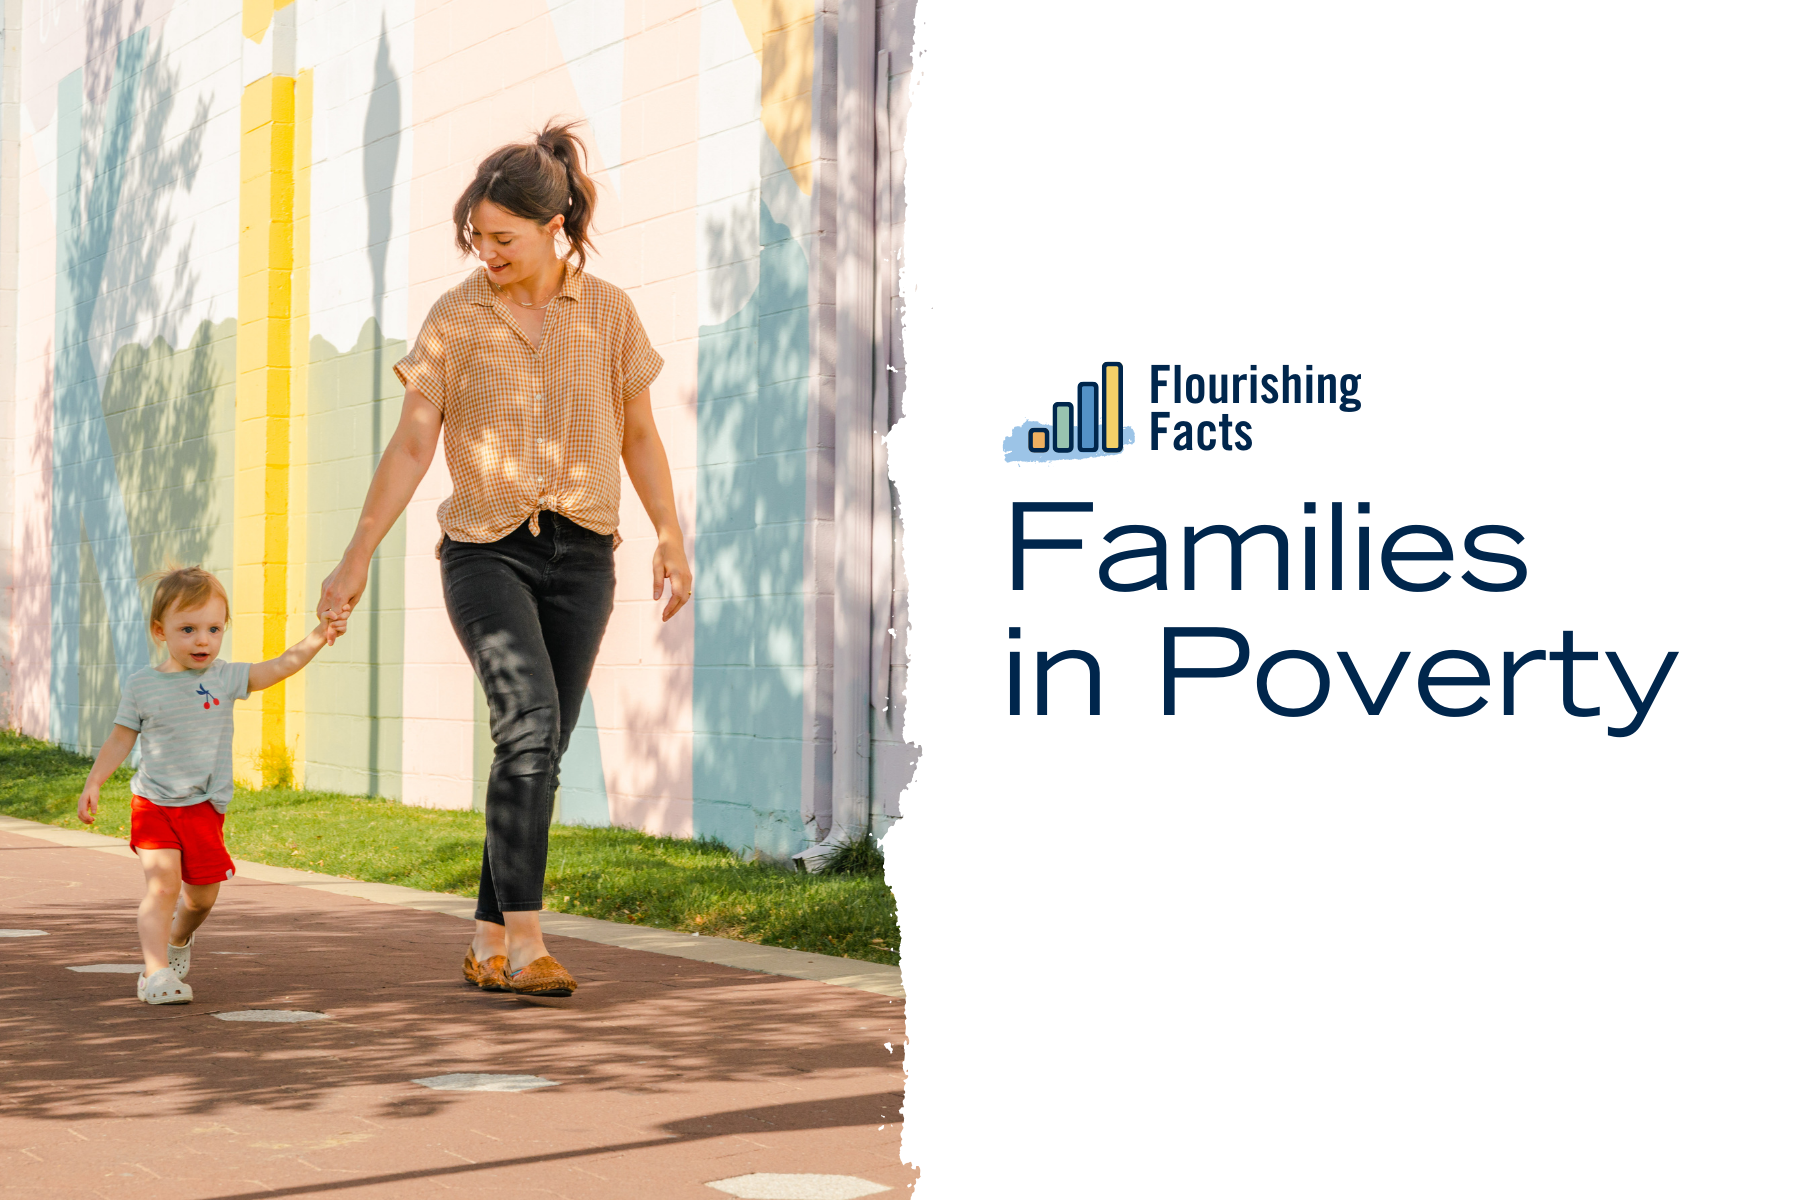
Flourishing Facts – Families in Poverty

Why is poverty data important?

Imagine being a single mother trying to put food on the table for your kids. Every penny counts, but even working two jobs, you barely scrape by. This is the reality for too many in the greater Evansville region, where 15% of families with children grapple with poverty. And when you also consider the additional 37% of “ALICE” families who are technically over the poverty threshold but are not making ends meet, that’s a lot of households struggling financially. This burden impacts everything, from access to healthy food to affording a safe home. But it’s not a uniform struggle. While poverty overall has decreased over the last five years of data, some rural areas like Boonville and Fort Branch saw a worrying rise. And the fight is far from over for communities of color, burdened with disproportionately high rates.

There is some good news for neighborhoods.

*Greater Evansville Region includes Vanderburgh, Warrick, Gibson, Posey, IN and Henderson, KY.  “Poverty Rates for Families with Children” data comes from the most recent American Community Survey data release, 2022, soon to be updated in Grow/SAVI.

WBF has a high level of investment and partnership with poverty-alleviation efforts through Place-based initiative investing. Grantee partners like Community One, Potter’s Wheel, Dream Center, Hope City Church, Audubon Kids Zone, and others work alongside community partners and funders like us to increase flourishing through a relational, asset-based approach.

Find more data on poverty and related issues

Poverty solutions are complex and data helps empowers action. Here are some ways to learn more about poverty in areas you serve and care about.

(Pro tip: not all data is available for small geographies, like neighborhoods. If you run into missing data, try a slightly larger area, like the zip code that encompasses the neighborhood.)

Share something you learn or that inspires you with your co-workers, collaborations, or community partners!