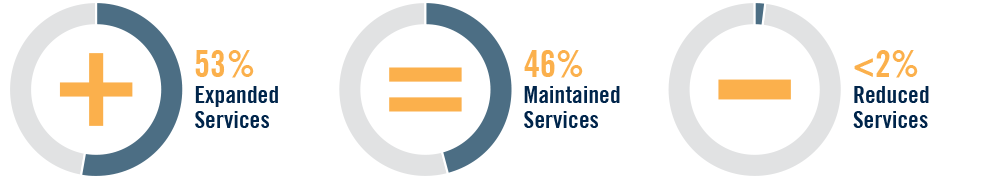
Q: In the previous fiscal year, did your organization expand services, reduce services, or stay the same?
Nearly all (99%) nonprofits maintained or expanded services in their previous fiscal year.
Just over half of nonprofits expanded their services. Expansions often include an increase in facilities, geographic footprint, or number of people served. Just under half of nonprofits said they maintained services and a small percentage (<2%) reduced services.
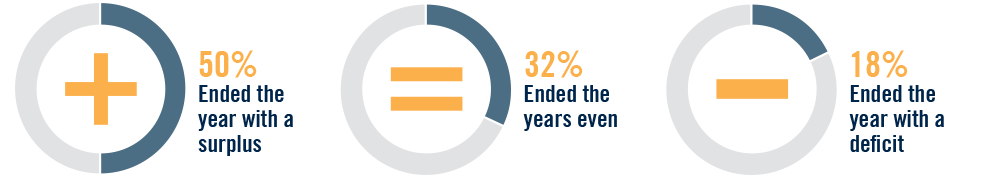
Q: In your most recent fiscal year, did your organization end with a budget surplus, deficit, or did you break even?
Most nonprofits (82%) ended their most recent fiscal year in a healthy financial position.
In fact, half (50%) report a budget surplus, and another third (32%) broke even. Fewer nonprofits (18%) ended the year in deficit, down from 25% in 2018. Organizations with budgets over $500K are less likely to have a budget deficit (16%) compared to smaller organizations (19%).
Lasting Impacts of COVID-19
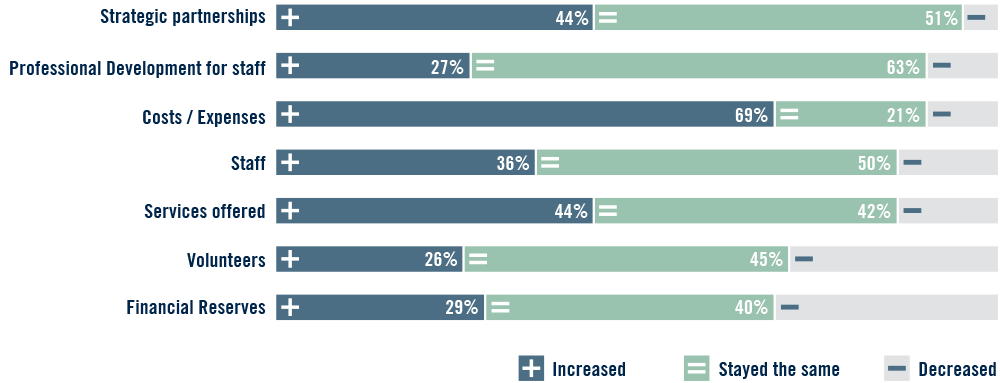
One goal of the current survey was to explore the lasting impact of COVID-19 on the nonprofit landscape. While many organizations made temporary adjustments in response to the pandemic, participants of this study answered questions related to the state of their organizations now compared to before COVID-19.
Nonprofits were asked to report on their revenue and demand for services now compared to before the COVID-19 pandemic. Three out of four reported organizational revenue is the same (38%) or higher (39%) and nearly all reported that demand for services is the same (37%) or greater (57%) than before COVID-19.
At the same time, 69% of organizations reported that their costs and expenses have increased since before the COVID-19 pandemic, suggesting financial strain to meet the increased needs and demands for services.
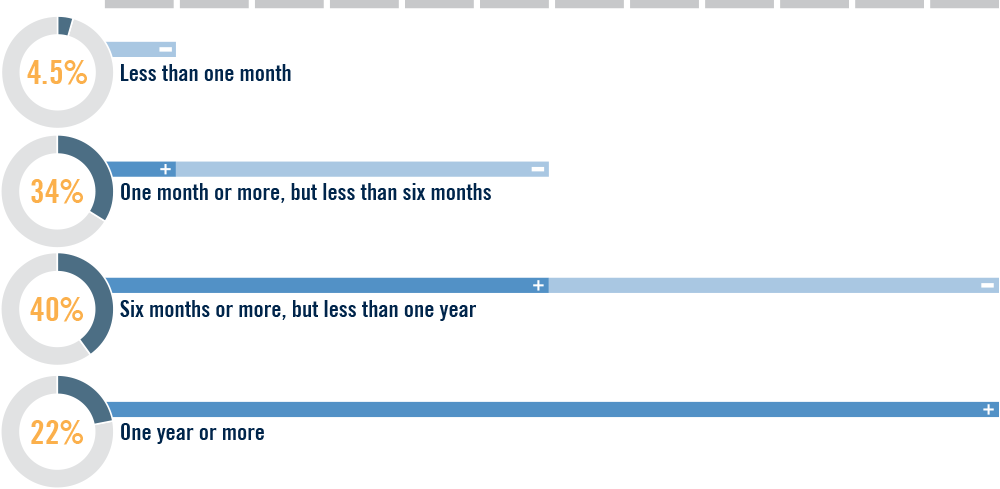
Q: Currently, how many months of operating revenue does your organization have in reserve?
More nonprofits have reserves to address a financial crisis.
Nearly two-thirds of 62% of nonprofits have at least six months of operating revenue in their reserves, up from 50% in 2018. Without some reserves, nonprofits are vulnerable to a financial crisis in the event of dramatic changes in the economy, loss of donors or grants, or unanticipated expenses.
Q: What was your approximate annual operating budget for the most recent fiscal year?
Just under half of nonprofits surveyed operate with an annual budget of less than $500,000, just over half have a budget over $500,000.
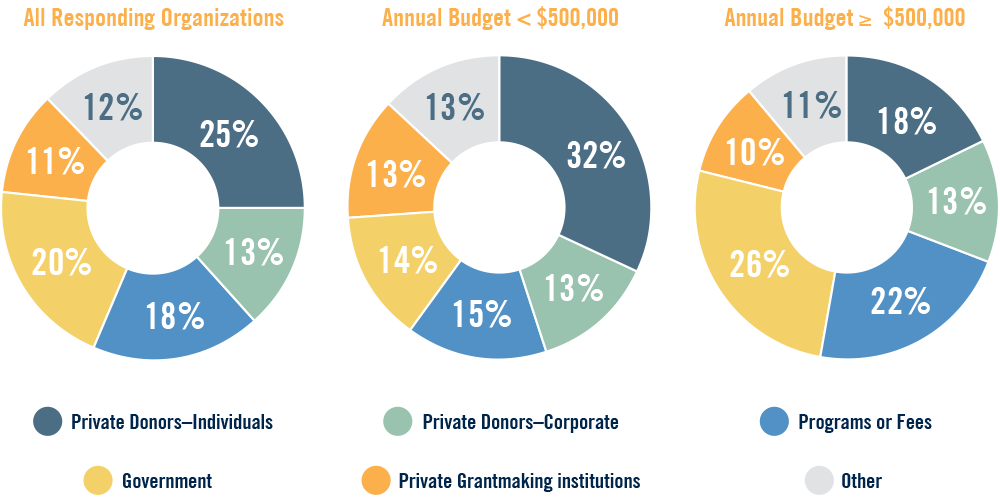
Q: Approximately what percent of your total revenue is derived from the following sources?
Individual donors make up the largest portion of the overall funding mix for nonprofits, but there are differences by organization size.
Smaller nonprofits rely more on private donors, accounting for 32% of their funding, compared to 18% for larger nonprofits. On the other hand, larger nonprofits get more funding from government sources (25%) and programs or fees (22%) compared to smaller nonprofits (14% each).
While funding models may differ slightly among organizations, a diverse funding mix, particularly one with a robust base of individual donors, enables organizations to navigate financial changes, such as the loss of grants or market fluctuations.
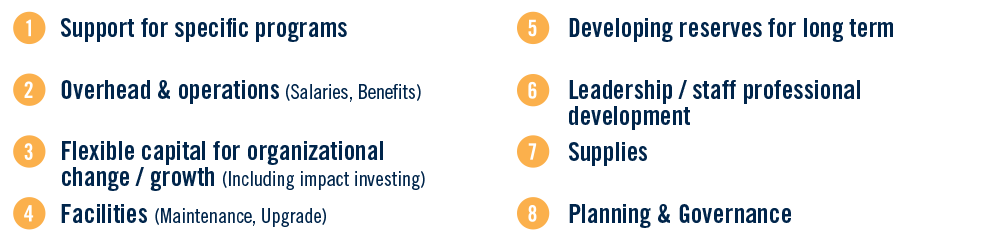
Q: Please rank the priority of the following funding needs for your organization from most important (1) to least important (8).
Nonprofits identify support for programming as their number one funding need.
Nonprofits ranked funding needs from 1 to 8 (1 = highest priority and 8 = lowest priority). The average of their rankings is presented below. With minor exceptions, the funding needs in the top half of the rankings indicate ‘short-term’ or immediate needs and those in the bottom half of the rankings largely indicate a ‘longer-term’ focus. Nonprofits indicated a similar ranking pattern in the 2018 survey with only minor differences, (Facilities was 3 and Flexible Capital was 4.)
The top two funding needs, support for programs and overhead/operations are the same for both small and large budget nonprofits. However, some variation in need appears to be associated with budget size. For example, flexible capital is a much higher priority among organizations with budgets of at least $500K and supplies are a much higher priority among organizations with budgets of less than $500K.
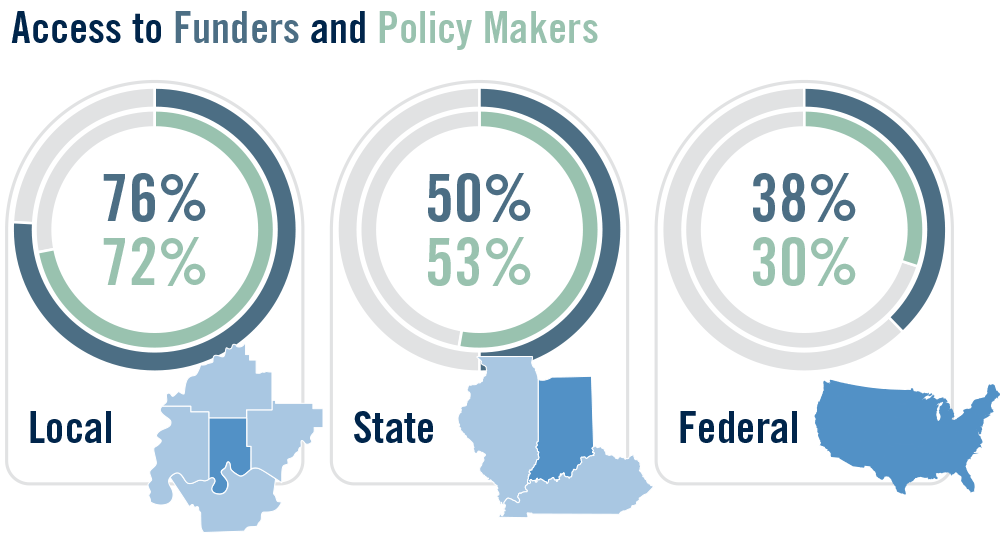
Q: Does your organization have access to any of the following groups? (Local, state, federal funders, and policy makers.)
Nonprofits are more likely to lean on local funding and policy resources, though federal funding has become more accessible.
Access to both funding sources and policymakers at the local, state, and federal level is important for nonprofit sustainability and for lasting changes in the region. Across surveyed nonprofits, access to funders and policymakers is greatest at the local level. Additionally, half of all nonprofits report that they have access to funders and policymakers at the state levels, and a third to funders and policy makers at the federal levels. Access to federal funders has increased since 2018. Over a third (38%) of nonprofits said they can access federal funders compared to 29% in 2018.