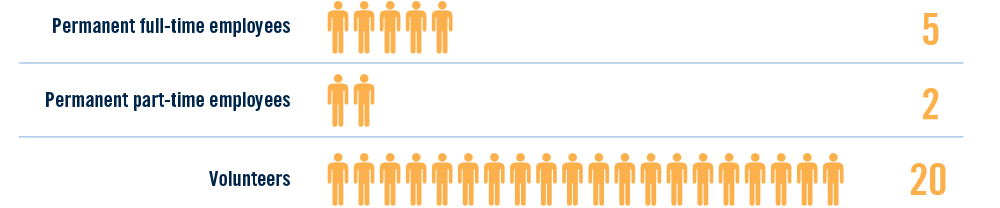
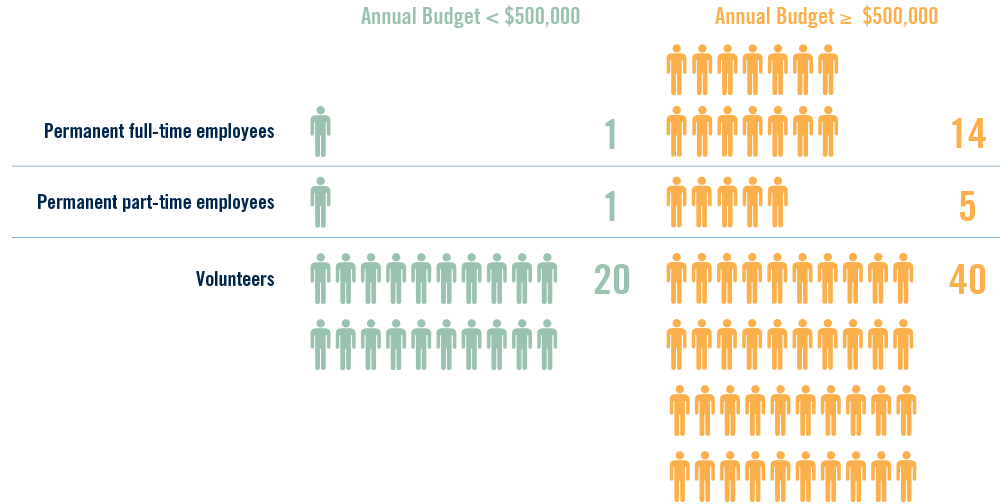
Q: Please indicate how many employees/volunteers of each type you had on average during the most recent fiscal year:
Nonprofits rely on small numbers of staff and larger volunteer networks, though there have been shifts over the last few years.
Nonprofits are hiring more staff and relying less on volunteers. The median organization now has five full-time employees, up from three in 2018, while volunteer numbers have dropped from 50 to 20. This shift might be due to COVID-19. The pandemic increased demand for services for many organizations, making volunteers harder to find and retain. Additionally, economic factors might push potential volunteers towards paid work. Hiring full-time staff offers more stability and paid positions may be easier to fill and keep staffed.
*The data above represents the median values for each group.
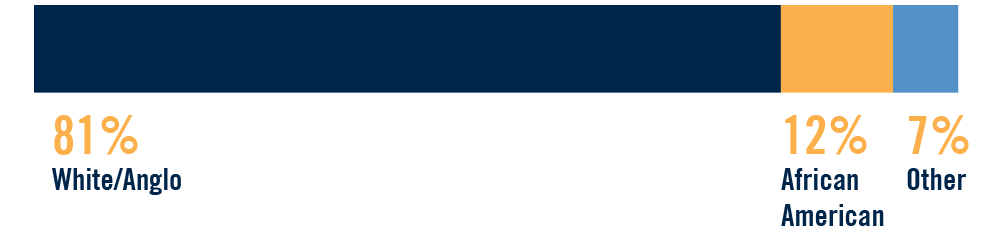
Q: Please indicate how many of your staff members identify as: (African American, Asian/Pacific Islander, Latino/a or Hispanic, Middle Eastern, Native American, White/Anglo, Multiracial, other)
Nonprofit staff, like the region, are becoming more diverse.
While white staff still make up the majority at 81%, their numbers have shrunk since 2018 (down from 86%). The representation of African American staff has grown substantially from 8% to 12% in the same period. This suggests a shift towards a more diverse nonprofit workforce. For comparison, the overall racial distribution in our region according to recent census data is 86% White and 7% African American/Black.
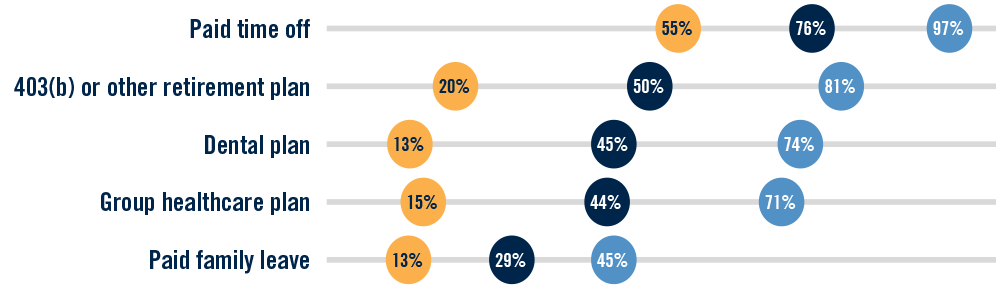
Q: Which of these employee benefits do you currently offer?
Nonprofit employment often comes with minimal paid benefits, but nonprofits are working to change this.
While nonprofits play a vital role in serving our communities, many of their employees have limited access to employment benefits. But there is good news. Compared to 2018, nonprofits are offering more benefits to their employees. Paid Time Off jumped from 65% to 78%, Retirement Plans from 35% to 50%, Group Healthcare from 31% to 44%, Dental Plans from 30% to 45%, and Paid Family Leave from 20% to 29%. These improvements highlight the ongoing efforts by nonprofits to enhance their employment benefits.
Collaboration is key. While progress is evident, only 17% of nonprofits work together on benefits. This suggests an opportunity for them to join forces (like with group healthcare plans) to offer even more affordable benefits to their staff.
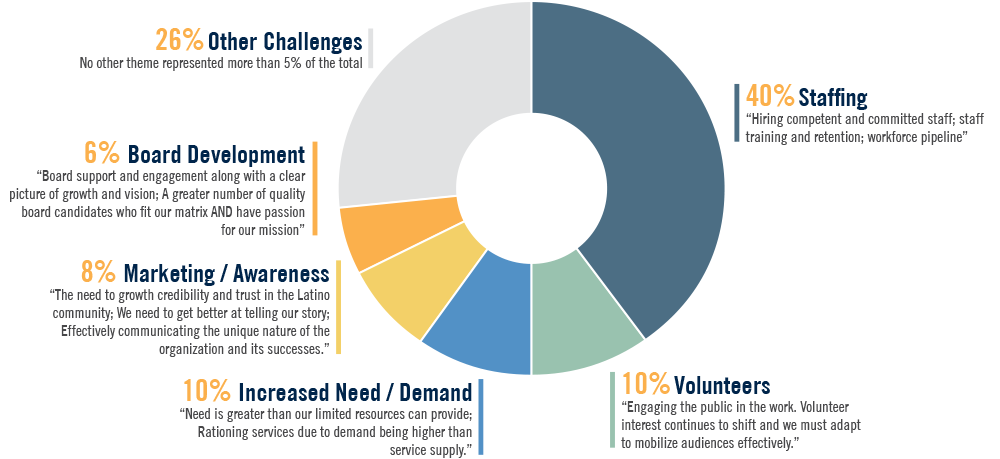
Q:Aside from funding, what is your organization’s biggest challenge?
Area nonprofits face several challenges, with staffing at the top of the list.
Other than securing funding – nonprofits list hiring and maintaining staff as the most prevalent challenge they face, accounting for 40% of all responses. Nonprofits are concerned about things like attracting competent and committed staff and developing a workforce pipeline.